

In the morning hours of November 9, 2023, the Bitcoin price crossed the $36,000 threshold—a level not reached since falling below it in May 2022.
Many hope that Bitcoin ETF applications from major players like BlackRock, Fidelity, VanEck, and ARK21Shares, among others, will boost the price even further if approved.
The latest figures from Bloomberg analysts give a 90% chance of a blanket Bitcoin ETF approval by January 10, 2024.
A recent CryptoQuant study suggests that around $155 billion could flow into the crypto market if these Bitcoin ETFs are approved. CryptoQuant gave its reason for this estimate:
“The total Assets Under Management (AUM) of these companies are around $15.6 trillion. If they were to put 1% of their AUM into these Bitcoin ETFs, the total US dollar amount that would enter the Bitcoin market would be around $155 billion.”
So far, the BTC price has reached a high of $36,863 and has barely experienced any retracement at all.
Bitcoin (BTC) Resumes Ascent Above Long-Term Resistance
A glance at the weekly timeframe chart immediately reveals the importance of the $31,000 horizontal area. The area has acted as both support and resistance since December 2020.
Read More: 9 Best Crypto Demo Accounts For Trading
The most recent rejection occurred in July 2023 (red icon). After regaining its footing, BTC accelerated its rate of increase in October and broke. Since accelerating its increase (green icon), BTC has created four successive weekly bullish candlesticks, even though the current one has yet to close bullish.
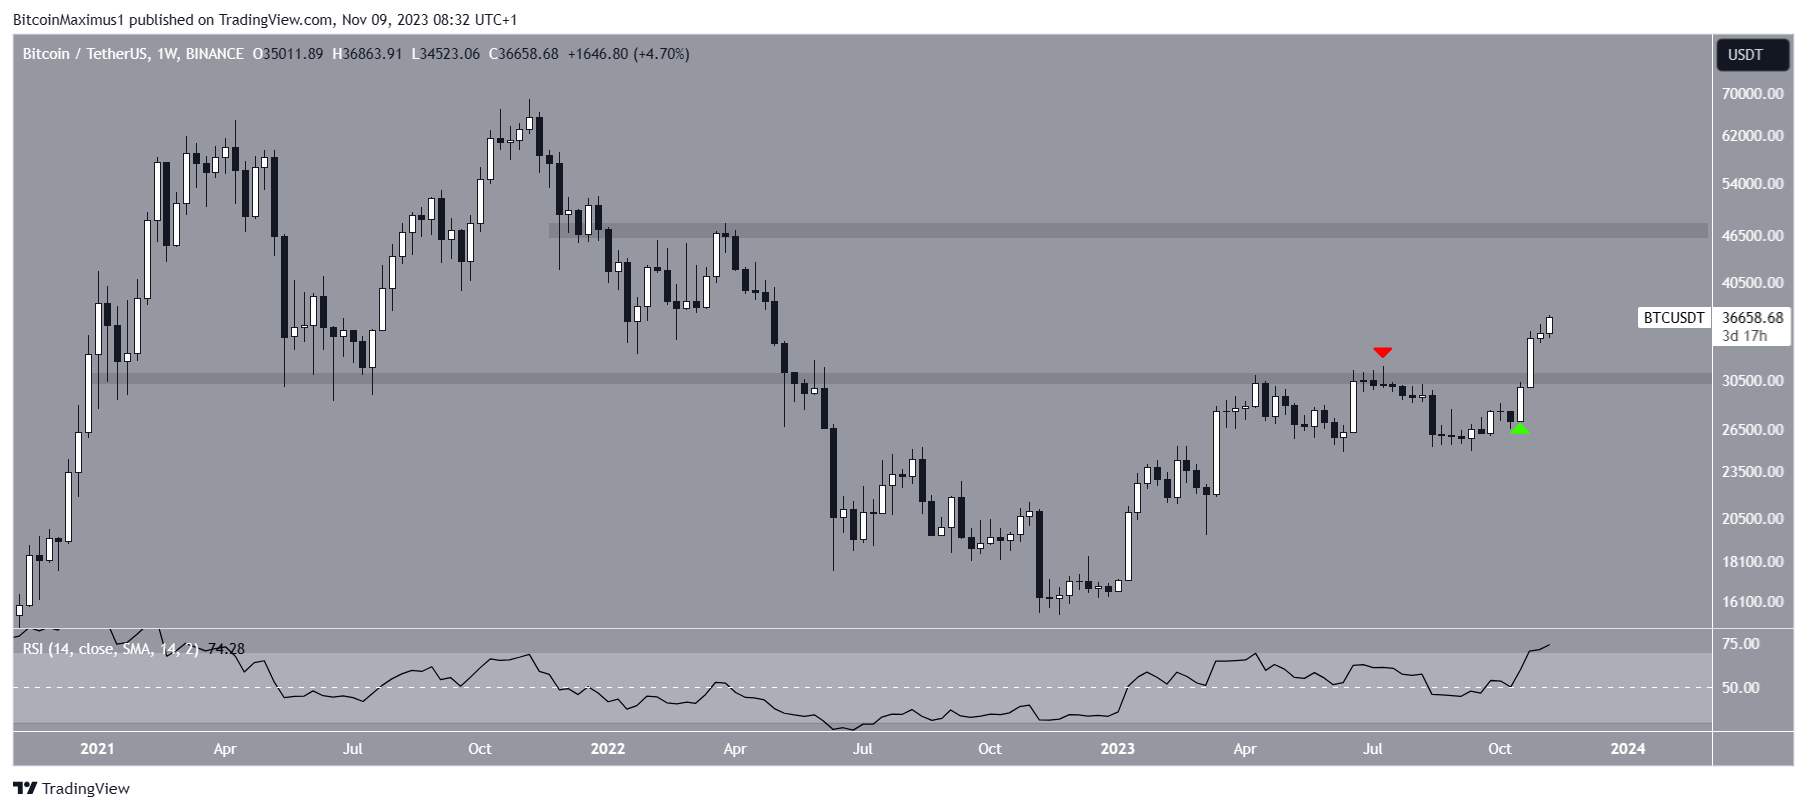
Market traders use the Relative Strength Index (RSI) as a momentum indicator to identify overbought or oversold conditions and to decide whether to accumulate or sell an asset.
Readings above 50 and an upward trend indicate that bulls still have an advantage, whereas readings below 50 suggest the opposite.
The RSI is increasing and is above 50, both considered signs of a positive trend.
Read More: 9 Best AI Crypto Trading Bots to Maximize Your Profits
BTC Price Prediction: Next Stop at $40,000?
Technical analysts employ the Elliott Wave theory as a means to identify recurring long-term price patterns and investor psychology, which helps them determine the direction of a trend. The wave count is bullish, supporting the continuing of the increase.
The most likely wave count suggests that BTC reached its bottom in June 2022 and began a five-wave increase (white).
If the count is correct, BTC is currently in wave three of this five-wave increase. Giving waves one and three a 1:1 ratio will lead to a high of $50,300. This also aligns with a horizontal resistance area. The target is 40% above the current price.
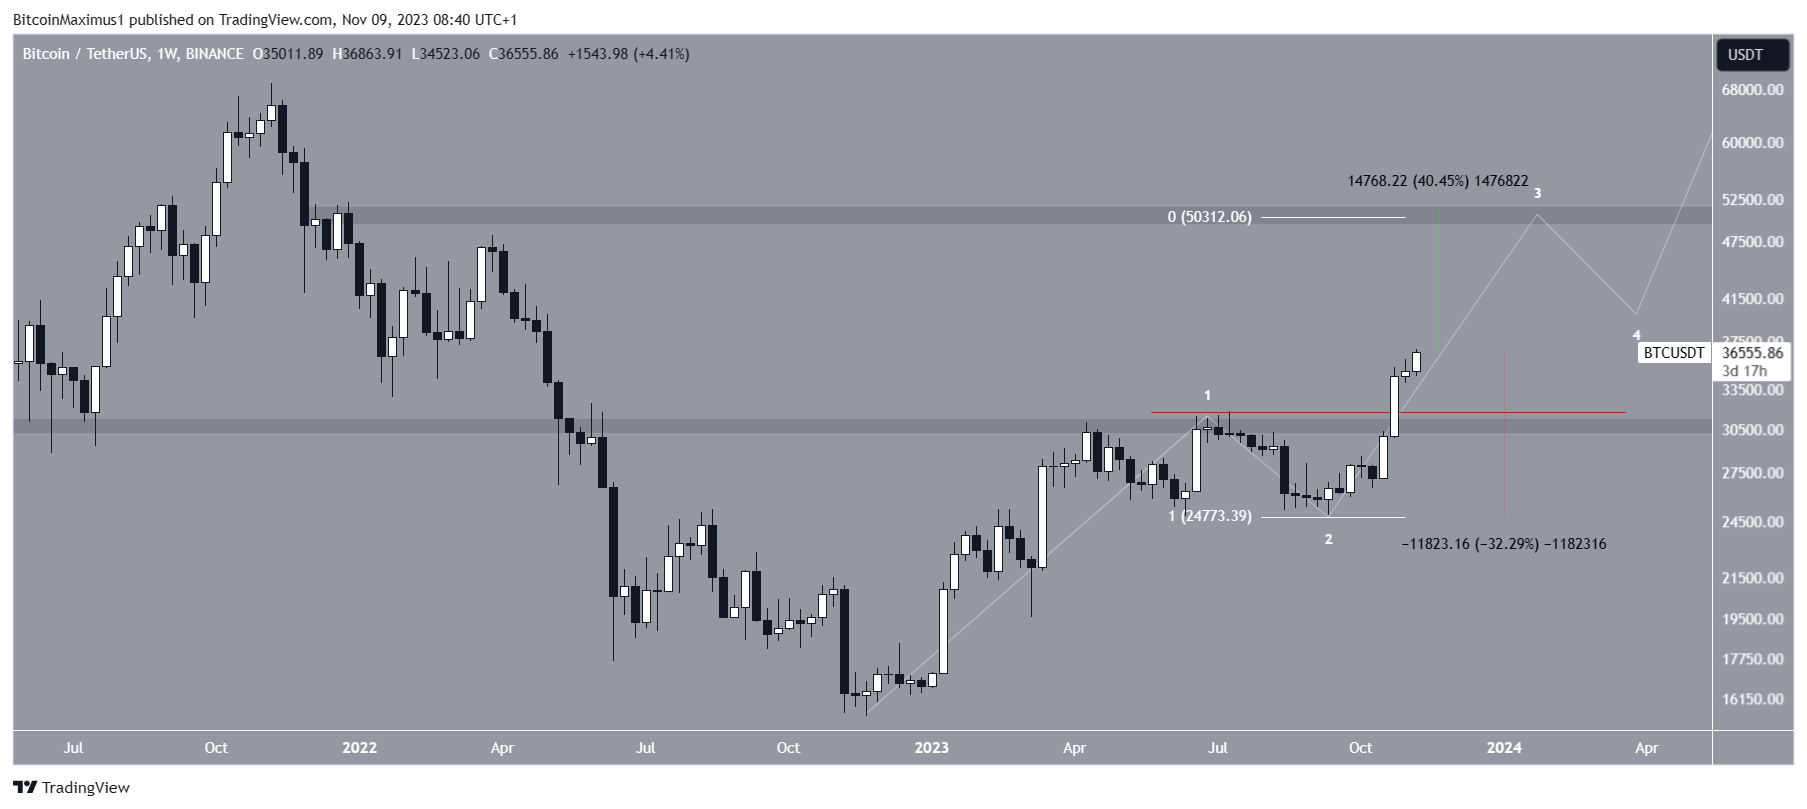
Despite this bullish BTC price prediction, a decrease below the wave one high (red line) at $31,800 will invalidate the bullish count. In that case, BTC could decrease by 30% and reach the closest support at $24,500.
For BeInCrypto’s latest crypto market analysis, click here.
Disclaimer
In line with the Trust Project guidelines, this price analysis article is for informational purposes only and should not be considered financial or investment advice. BeInCrypto is committed to accurate, unbiased reporting, but market conditions are subject to change without notice. Always conduct your own research and consult with a professional before making any financial decisions.
Be the first to comment